
Market Commentary | March 2021
Rob Kellogg, CFA®


THE MARKET
After a volatile month, the S&P 500 finished at a record high when the markets closed on March 31st. The index finished the month up 4.24% and is now up 5.77% on the year. As the economic recovery continues, the Dow Jones Industrial Average led the monthly performance numbers as it finished up 6.62% and is now up 7.76% on the year. The technology heavy NASDAQ finished the month in positive territory, but it continues to lag the other two indices after outperforming both in 2020. The index finished the month up 0.41% and is now up 2.78% on the year. Small cap stocks continued to inch higher as the Russell 2000 ended the month up 0.88% and is now up 12.44% on the year. The MSCI EAFE index is up just under 3% on the year after a positive month, however the MSCI Emerging Markets index fell 1.70% during the month and is now up 1.95% on the year. The Bloomberg Barclay’s U.S. Aggregate Bond index fell 1.25% in March and is now down 3.37% on the year.1
| Index Returns (as of 3/31/2021) | Level | March | QTD/YTD |
|---|---|---|---|
| S&P 500 | 3972.89 | 4.24% | 5.77% |
| Dow Jones Industrial Average | 32981.55 | 6.62% | 7.76% |
| NASDAQ Composite | 13246.87 | 0.41% | 2.78% |
| Russell 2000 | 2220.52 | 0.88% | 12.44% |
| MSCI EAFE | 2208.32 | 1.82% | 2.83% |
| MSCI Emerging Markets | 1316.43 | -1.70% | 1.95% |
| U.S. Aggregate Bond | - | -1.25 | -3.37% |
Source (1)
THE ECONOMY
As has been the case for much of the last year, the economy is shaped in large part by the pandemic and our country’s policy response to challenges that have come to light because of the virus. The first quarter of 2021 was one of transition. There was the transition in the White House and on Capitol Hill, and towards implementation of the Covid-19 vaccine. The transition in Washington, D.C. will dictate our country’s policy response to the virus while the vaccines have taken center stage regarding the pandemic.
Since March of 2020, the economy has experienced a massive drop followed by a surge and we continue to inch forward in our new social distancing driven economy. Final numbers for GDP growth in the fourth quarter of 2020 came in at 4.3%.2 The month of March closed with strong economic numbers and estimates for first quarter GDP growth are now at 6%. GDP numbers are seasonally adjusted annual rates. In March, personal consumption growth increased from 5.6% to 6.9% and private investment growth increased from 2.4% to 6.9%.3 The ISM Index also reaching its highest level since 1983 as it climbed to 64.7 in March, up from 60.8 in February.4 Goldman Sachs now estimates GDP to finish the year up 8% year over year which would signal a full recovery to pre-pandemic levels. For reference, U.S. GDP has not grown 8% in a year since 1951.5
Nonfarm payrolls increased by almost 1,000,000 in March and the unemployment rate fell to 6.0%, an improvement from 6.2% in February.6 Unemployment reached its pandemic peak of 14.8% in April of 2020. After the announcement of the most recent stimulus package in March, the Fed estimated inflation will reach 2.4% this year, above its previous estimate of 1.8%.7 Earnings for companies in the S&P 500 were down 11% in 2020, however, they are projected to increase by over 25% in 2021.8 That is positive news for equities, but we do want to exercise caution as we look at estimates in 2022. Higher interest rates could cause wage growth, there is the potential for higher corporate taxes, and the economy could slow as we enter 2022. Regarding the Fed, following their recent meeting on St. Patrick’s Day in March, they plan to maintain the target federal funds rate of 0-0.25 bps through 2023 and continue bond purchases throughout the remainder of 2021.9 If the economy does perform as well as expected to close out 2021, it’s possible that the Fed may need to taper back bond purchases in 2022 to curb fears of inflation. As of now, inflation is still in a relatively comfortable range, but it is worth monitoring as more financial stimulus enters the economy.
THE VIRUS
As the first quarter came to an end in 2020, we were still in the early stages of the pandemic, local governments were just starting their lockdowns, and every news station had a permanent number on the side of their screen tracking the growth of coronavirus cases. Twelve months later we are still tracking cases and fatalities, but just as important is tracking our progress towards herd immunity. Herd immunity can potentially be achieved through a combination of tracking those that have been infected by the virus along with those that have been vaccinated. The first image below shows the large decrease in cases and deaths on a 7-day moving average in the first quarter of 2021 due in large part to the roll out of the vaccines. As you can see in the second image, the total number infected by the virus is starting to plateau and the number of those vaccinated is beginning to increase.
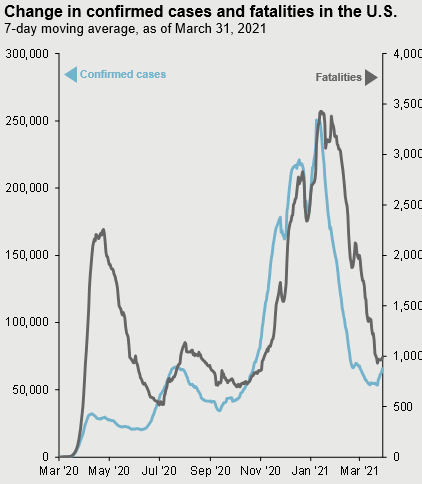
Source (10)
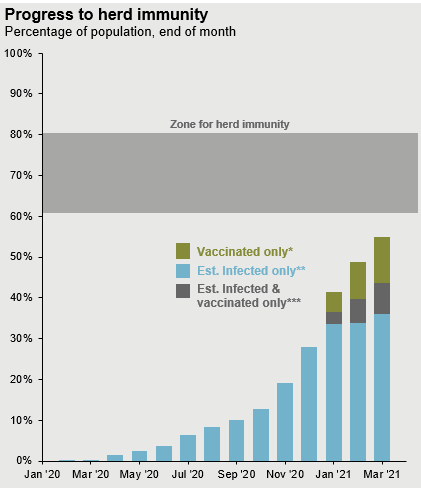
Source (10) - *Share of the total population that has received at least one vaccine dose. **Est. Infected represents the number of people who may have been infected by COVID-19 by using the CDC’s estimate that 1 in 4.6 COVID-19 infections were reported. ***Est. Infected & vaccinated only assumes those infected equally likely to be vaccinated as those not infected.
The percentage of the population experiencing immunity has increased to over fifty percent at the end of the first quarter, and J.P. Morgan’s analysts project that we will enter the 60-80% zone of herd immunity in April (65%) and surpass the zone by the end of the second quarter (85%).11 These numbers are supported by the image below showing the results of a recent Gallup poll. The percentage of Americans willing to get the vaccine has increased from 50% in September of 2020 up to 74% in March of 2021.12 The important note is that we are making progress towards herd immunity. These numbers lead us to believe that we will be in a much better spot regarding the pandemic as we enter the third quarter of 2021.
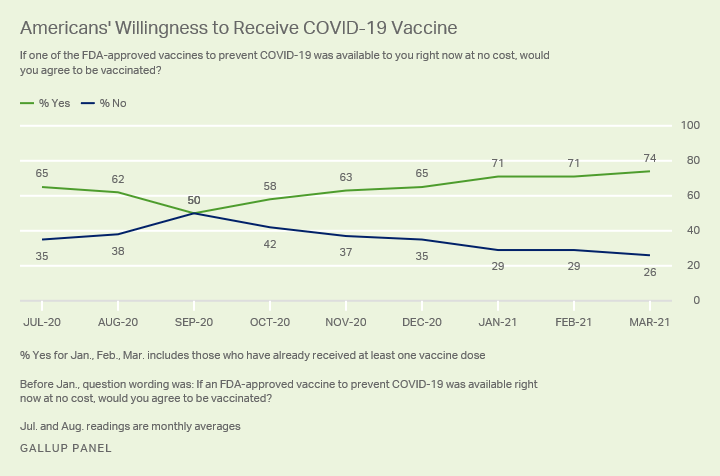
Source (12)
POLICY RESPONSE
President Joe Biden signed the $1.9 trillion American Rescue Plan on March 11th. It provided direct $1,400 payments to Americans making under $75,000. It also provided aid to state and local governments, extended unemployment benefits, expanded tax credits, provided aid to small business, and helped with the Covid-19 response.13
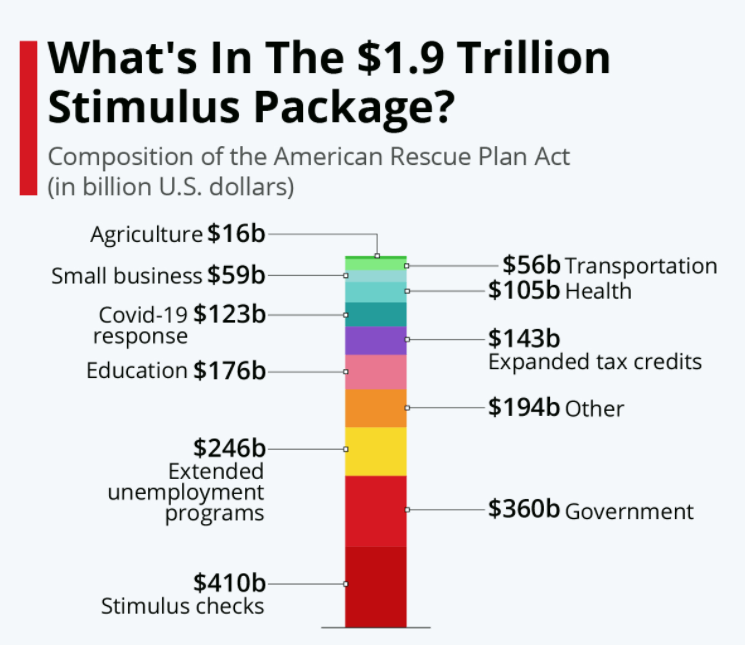
Source (13)
The plan was an economic aid package designed to help Americans and businesses survive the pandemic downturn. However, the plan did little to advance Biden’s long term economic agenda when it comes to infrastructure and transitioning to renewable energy, so on Wednesday, March 31st, President Biden introduced the American Jobs Plan. The bulk of the plan is to be spent on infrastructure with over $600 billion dedicated to transportation infrastructure (highways, public transit) and another $600 billion going to community infrastructure (clean drinking water, housing, schools, VA hospitals). $580 billion will go towards research and development, manufacturing, and workforce development. The plan is rounded out with $400 million dedicated to improving elderly care.14 The plan will still need to go through Congress, but it is likely that at least some trimmed down version of the plan is passed. How is the plan going to be funded? The likely solution is Biden’s Made in America Tax Plan that would undo a lot of changes from former President Trump’s Tax Cuts and Jobs Act in 2017. The main change is raising the corporate tax rate from 21% to 28% which is expected to raise the $2 trillion needed for funding over the next 15 years. The American Jobs Plan is the first of two plans that Biden will introduce following the passing of the American Rescue Plan. The next plan, likely to be introduced in April, will be the American Family Plan that will aim to address healthcare and education.15 This plan will also try to extend benefits to lower and middle-income earners targeting three programs: expanding the Earned Income Tax Credit to help more Americans over the age of 65, the Dependent Care Credit for help with daycare allowing both spouses to return to work, and the Child Tax Credit.11
CONCLUSION
It has now been a full calendar year since markets experienced their massive correction due to the pandemic, and the S&P 500 ended the month of March at a new record high. It was a bumpy ride as there were concerns regarding the potential for higher inflation and rising bond yields, specifically the 10-year treasury. As alluded to earlier, corporate earnings are set to see growth of over 25% in 2021, the economy is likely to continue its expansion as U.S. real GDP is estimated at 8% growth in 2021, and more Americans are financially stable with money to spend due to a combination of financial stimulus along with pent up demand. All of those bode well for equities. However, potential inflation could prove negative for equities, and it will likely mean increased volatility throughout the remainder of the year. Even though rising yields are not a good sign for bonds, it is wise to maintain fixed income exposure due to its low correlation to equities. We recommend staying in your asset allocation driven risk-based portfolios due to the uncertainties regarding the economic recovery. We have never experienced a recovery from a pandemic in modern times, so we can’t confidently predict exactly how things will unfold. We do know that value stocks usually perform better in higher inflationary environments, but also that we do need exposure to growth as the year comes to an end and the economic recovery begins to slow. International equities still look relatively cheap from a valuation perspective and should yield higher dividends compared to their counterparts in the United States. International fixed income and emerging market debt are also providing stronger yields with higher credit quality than past years. The important take away is that there are meaningful reasons to maintain a diversified approach based on your risk tolerance, and why each asset class should have some exposure in your portfolios. It is imperative that you have the right expectations for how your portfolio should perform. If you’d like to review those expectations or revisit your risk tolerance, please don’t hesitate to reach out
1 https://www.investing.com/indices/major-indices
3 https://www.frbatlanta.org/cqer/research/gdpnow
4 https://www.cnbc.com/2021/04/01/ism-manufacturing-march-2021.html
6 https://www.cnbc.com/2021/04/02/us-jobs-report-march-2021.html
9 https://www.federalreserve.gov/monetarypolicy/files/monetary20210317a1.pdf
10 Centers for Disease Control and Prevention, Johns Hopkins CSSE, Our World in Data, J.P. Morgan Asset Management. Guide to the Markets – U.S. Data are as of March 31, 2021.
12 https://news.gallup.com/poll/342431/satisfaction-vaccine-rollout-surges.aspx
13 https://www.statista.com/chart/24395/composition-of-the-american-rescue-plan-act/
14 https://www.investopedia.com/what-s-in-joe-biden-s-usd2-trillion-american-jobs-plan-5120273
15
https://www.forbes.com/advisor/personal-finance/biden-american-jobs-plan/
Returns are based on the S&P 500 Total Return Index, an unmanaged, capitalization-weighted index that measures the performance of 500 large capitalization domestic stocks representing all major industries. Indices do not include fees or operating expenses and are not available for actual investment. The hypothetical performance calculations are shown for illustrative purposes only and are not meant to be representative of actual results while investing over the time periods shown. The hypothetical performance calculations for the respective strategies are shown gross of fees. If fees were included returns would be lower. Hypothetical performance returns reflect the reinvestment of all dividends. The hypothetical performance results have certain inherent limitations. Unlike an actual performance record, they do not reflect actual trading, liquidity constraints, fees and other costs. Also, since the trades have not actually been executed, the results may have under- or overcompensated for the impact of certain market factors such as lack of liquidity. Simulated trading programs in general are also subject to the fact that they are designed with the benefit of hindsight. Returns will fluctuate and an investment upon redemption may be worth more or less than its original value. Past performance is not indicative of future returns. An individual cannot invest directly in an index.
This material has been prepared for information and educational purposes and should not be construed as a solicitation for the purchase or sell of any investment. The content is developed from sources believed to be reliable. This information is not intended to be investment, legal or tax advice. Investing involves risk, including the loss of principal. No investment strategy can guarantee a profit or protect against loss in a period of declining values. Investment advisory services offered by duly registered individuals on behalf of ChangePath, LLC a Registered Investment Adviser.