
Market Commentary | June 2021
Rob Kellogg, CFA®


THE MARKET
The S&P 500 Index continues to climb in June as it finished the month up 2.22% leading to a 14.41% increase on the year. The technology heavy NASDAQ led the way during the second quarter as it was up 9.50% on the quarter following a strong June, and it is now up 12.50% on the year. The Dow Jones Industrial Average (DJIA) did not follow suit during the month of June as it was down 0.08%, but the index is still up nearly 13% on the year.1
| Index Returns (as of 6/30/2021) | Level | June | 2nd Quarter | YTD |
|---|---|---|---|---|
| S&P 500 | 4297.50 | 2.22% | 8.17% | 14.41% |
| Dow Jones Industrial Average | 34502.51 | -0.08% | 4.61% | 12.73% |
| NASDAQ Composite | 14504.00 | 5.50% | 9.50% | 12.50% |
| Russell 2000 | 2310.55 | 2.32% | 4.05% | 17.00% |
| MSCI EAFE | 2304.92 | -1.25% | 4.37% | 7.33% |
| MSCI Emerging Markets | 1374.64 | -0.11% | 4.42% | 6.46% |
| U.S. Aggregate Bond | - | 0.70% | 1.83% | -1.48% |
Source (1)
The Russell 2000 small cap index continues to lead during 2021 as it is now up 17.00% on the year after a 2.32% increase for the month of June. Both the MSCI international and emerging market indices were down during the month of June, but the MSCI EAFE is still up 7.33% on the year and the MSCI Emerging Markets Index is up 6.46% for 2021. Fixed income continued a steady second quarter as the Bloomberg Barclays US Aggregate Bond TR index was up 0.70% for the month leading to an increase of 1.83% during the quarter. The U.S. Aggregate Bond index is still down 1.48% on the year.1
THE ECONOMY
THE PANDEMIC
As we enter the second half of 2021, the economy is experiencing a rapid reopening process. This, along with fiscal policy, will be drivers for economic numbers in 2021 and 2022 according to Dr. David Kelly, the Chief Global Market Strategist for J.P. Morgan.2 The rapid reopening process is a testament to how the United States handled the coronavirus pandemic in the first half of 2021. As you can see from the left image on the next page, fatalities and case numbers have dramatically decreased since January of this year; both by over 90%.
3
Source (3)
There is the new, more contagious Delta variant of the virus that has caused concern, but much of that concern is related to unvaccinated individuals. There is much more to learn about the Delta variant, but the best protection against the virus has proved to be the vaccine.4 As of July 5th, 2021, over 157 million people in the United States were considered fully vaccinated.5 When you combine that number with those that have been previously infected by the virus, it is estimated that nearly 75% of the United States population is considered immune to the virus which is shown in the right image above.3 It is not a coincidence that the rapid decrease in cases and fatalities shown in the left image above is a direct result of the rise in vaccinations shown in the right image. Nearly all COVID-19 deaths in the U.S. are now people who were not vaccinated. Of the 18,000 deaths from the virus that occurred in May, only 150 of those individuals were vaccinated.6
As the vaccination numbers go up and the case numbers go down, the economy continues to experience a rapid reopening. The image below shows economic activity in the United States since the start of the pandemic. Starting in March of 2021, the graph changes to a year over “2 years ago” number to represent current monthly activity compared to monthly activity prior to the pandemic. The image on the next page shows that activity continues to steadily increase with the number of people eating in restaurants, navigation app usage, and TSA traveler traffic representing the largest bounce backs from their lows last year.7
Source (7)
FISCAL POLICY
The other main driver to the U.S. economy will be fiscal and monetary policy. Fiscal policy, which is reflected by government decisions, will be represented more in the near term while monetary policy decisions by the Fed will continue to play out over time. On Thursday, June 24th, President Joe Biden announced “we have a deal” related to a major infrastructure initiative after meeting with a group of bipartisan Senators resulting in nearly $600 million of new spending. Of the nearly $600 million, over $300 million will go towards transportation such as roads, railroads, and public transit.8 As of July 6th, a Bipartisan group from the House of Representatives backed the Biden-Senate infrastructure deal.9 Many Democrats believe the bill is too small, but Biden believes that if he will be able to get his party to pass the bill. Some believe that Biden agreed to the trimmed down version of his infrastructure plan in order to get some form of his American Families Plan through Congress.10 This is important as it could lead to even more fiscal stimulus finding the pockets of Americans by making the Dependent Care Tax Credit permanent, extending the Child Tax Credits for another five years, and making the Earned Income Tax Credit permanent as well.11 Fiscal policy is important to monitor this year. It will become more difficult to pass items through Congress as we approach the midterm elections in November of 2022, and it is unlikely that the Democrats maintain complete control. In the meantime, more fiscal stimulus in 2021 will continue to be reflected in GDP numbers.
GDP
As the economy continues to reopen, estimates for 2021 second quarter US GDP are coming in just shy of 10% at an annualized rate. This follows 4.3% growth in the fourth quarter of 2020 and 6.4% growth in the first quarter of 2021.12 Dr. David Kelly of J.P. Morgan stated that if this does hold true, it will place US GDP over 1% higher than it was after the fourth quarter of 2019 and the country will have recovered all of its pandemic losses. GDP growth can be attributed to a myriad of things including the economic reopening, pent up savings, production increases due to low inventory, and child tax care credits starting to pay out on July 15th as a result of the American Rescue Plan.2
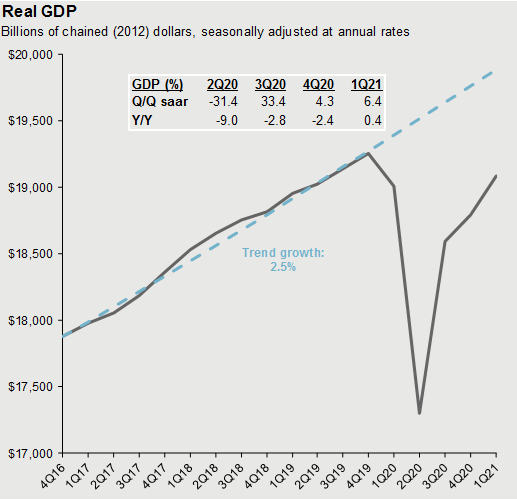
Source (13)
MONETARY POLICY
The Federal Reserve Board (Fed) is set to meet at the end of July and then again in September with their annual Jackson Hole meeting between the two.14 As the Fed continues to meet, the focus remains on two items: bond purchases and interest rates. When the Fed purchases bonds, it increases bond prices thus lowering interest rates, and therefore stimulating the economy. The same effect is had when they target a lower federal funds rate which makes the cost of borrowing lower and again, stimulates the economy. The Fed has been pulling these two levers for quite some time as the economy heals, but as GDP continues to increase and unemployment continues to decrease, many believe things could start to change. The Fed has stated before that they plan to keep interest rates as is at 0.00 to 0.25 % until 2023, but it’s possible that they could start tapering bond purchases at the end of this year. These lower interest rates lead to inflation which seems to be the headline fear for consumers today. The target inflation rate for the Fed is typically 2%, but most believe that the Fed will allow it to run higher before they pull levers attempting to lower it. Previous comments made by the Fed lead the public to believe that they think this current inflation is transitory, or temporary in nature, and that is why they have yet to do anything to lower it.15 However, as wage growth continues, the public begins to expect inflation. As they expect inflation, they will demand higher wages, and inflation may end up being less temporary than initially thought.2 Currently the Fed purchases $120 billion in bonds each month. Most experts believe that after one of their next three meetings, they will announce the tapering of bond purchases potentially ending all purchases by the end of 2022 before they begin to raise their target interest rates.16 All of this is to say that the Fed will likely continue to let inflation run doing their part to support the economy until they believe unemployment has reached a low enough level.
CONCLUSION
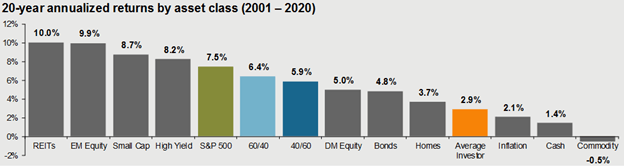
The United States economy is reopening, GDP is growing back above pre-pandemic levels, more fiscal stimulus could be on the horizon, and monetary policy continues to be easy. These have all attributed to markets reaching all time highs and continuing to grow. Because of this, it is important to look at the fundamentals and valuations in the equity market. United States growth stocks have been on quite the run as we saw a flight to quality during the pandemic and the introduction of a mass amount of younger, lower income retail investors. It’s possible this continues as the stimulus continues but valuations are high, and there is merit in leaning towards value stocks over growth stocks. As the rest of the world catches up to the United States in terms of vaccinations and economies reopening, there is value to be had internationally, specifically in select emerging market countries. This all leads to a globally diversified balanced equity portfolio. However, equity markets have been on quite the uninterrupted bull run since November of 2020, but the S&P 500 has experienced an average intra-year drop of 14.3% each year since 1980.2 Volatility is present and possible as retail investors continue to flood the markets. Portfolios may need something to offset equity markets should a correction occur and that is where high quality fixed income will fit. In order to achieve yield through fixed income, portfolios may need to move down in credit quality with a portion of the fixed income allocation. There are countless scenarios that could play out through the remainder of the year related to the virus, fiscal decisions, monetary decisions, and unexpected market events. We continue to emphasize a balanced approach given the state of the market based on your risk tolerance. As David Lebovitz from J.P. Morgan states, “It’s important to focus on a diversified approach as it leads to a more comfortable ride. If you are comfortable, you are likely to remain invested, and staying invested gives you the best chance to achieve a successful retirement.” 2 If you’d like to revisit your portfolio and discuss your risk tolerance, investment objectives and expectations, please reach out to schedule a conversation today.
1 – https://www.investing.com/indices/major-indices
3 – Source: Centers for Disease Control and Prevention, Johns Hopkins CSSE, Our World in Data, J.P. Morgan Asset Management. *Share of the total population that has received at least one vaccine dose. **Est. Infected represents the number of people who may have been infected by COVID-19 by using the CDC’s estimate that 1 in 4.6 COVID-19 infections were reported. ***Est. Infected & vaccinated assumes those infected equally likely to be vaccinated as those not infected. On 5/6/21, we moved up our threshold for herd immunity from 60-80% to 70-90% based on the comments by Dr. Anthony Fauci that the prevalence of more contagious variants have pushed up the target herd immunity threshold for the U.S. – J.P. Morgan – Guide to the Markets – U.S. Data are as of June 30, 2021.
4 – https://www.yalemedicine.org/news/5-things-to-know-delta-variant-covid
5 – https://ourworldindata.org/covid-vaccinations?country=USA
6 – https://apnews.com/article/coronavirus-pandemic-health-941fcf43d9731c76c16e7354f5d5e187
7 – Source: App Annie, Chase, Mortgage Bankers Association (MBA), OpenTable, STR, Transportation Security Administration (TSA), J.P. Morgan Asset Management. *Beginning 3/15/21, all indicators compare 2021 to 2019. Prior to 3/15/21, figures are year-over-year. Consumer debit/credit transactions, U.S. seated diners and TSA traveler traffic are 7-day moving averages. App Annie data is compared to 2019 average and includes over 600 travel and navigation apps globally, including Google Maps, Uber, Airbnb and Booking.com. Consumer spending: This report uses rigorous security protocols for selected data sourced from Chase credit and debit card transactions to ensure all information is kept confidential and secure. All selected data is highly aggregated and all unique identifiable information—including names, account numbers, addresses, dates of birth and Social Security Numbers—is removed from the data before the report’s author receives it. – J.P. Morgan – Guide to the Markets – U.S. Data are as of June 30, 2021
8 – https://www.cnn.com/2021/06/24/politics/biden-infrastructure-meeting-senators/index.html
11 – https://www.whitehouse.gov/american-families-plan/
13 – Source: BEA, FactSet, J.P. Morgan Asset Management. Values may not sum to 100% due to rounding. Forecasts are not a reliable indicator of future performance. – J.P. Morgan – Guide to the Markets – U.S. Data are as of June 30, 2021.
14 – https://www.federalreserve.gov/monetarypolicy/fomccalendars.htm
16 –
https://www.reuters.com/world/us/fed-expected-flag-start-monetary-policy-shift-debate-2021-06-16/
Returns are based on the S&P 500 Total Return Index, an unmanaged, capitalization-weighted index that measures the performance of 500 large capitalization domestic stocks representing all major industries. Indices do not include fees or operating expenses and are not available for actual investment. The hypothetical performance calculations are shown for illustrative purposes only and are not meant to be representative of actual results while investing over the time periods shown. The hypothetical performance calculations for the respective strategies are shown gross of fees. If fees were included returns would be lower. Hypothetical performance returns reflect the reinvestment of all dividends. The hypothetical performance results have certain inherent limitations. Unlike an actual performance record, they do not reflect actual trading, liquidity constraints, fees and other costs. Also, since the trades have not actually been executed, the results may have under- or overcompensated for the impact of certain market factors such as lack of liquidity. Simulated trading programs in general are also subject to the fact that they are designed with the benefit of hindsight. Returns will fluctuate and an investment upon redemption may be worth more or less than its original value. Past performance is not indicative of future returns. An individual cannot invest directly in an index.
This material has been prepared for information and educational purposes and should not be construed as a solicitation for the purchase or sell of any investment. The content is developed from sources believed to be reliable. This information is not intended to be investment, legal or tax advice. Investing involves risk, including the loss of principal. No investment strategy can guarantee a profit or protect against loss in a period of declining values. Investment advisory services offered by duly registered individuals on behalf of ChangePath, LLC a Registered Investment Adviser.